You poured hours into that dashboard. Why is nobody using it?
There is nothing more frustrating than spending days cleaning data, tweaking visuals, and building a sleek dashboard, only to get polite nods in a meeting, a buried link in Slack, and zero real adoption.
Learn the insight-first framework that took a company from from 4,000 to 45,000 daily views by turning charts into data stories.
The Truth About Why Dashboards Get Ignored:
When a dashboard just dumps data on a page without answering a burning question, stakeholders glance at it once and walk away.
Insights are what actually solve problems and make money.
To make your work matter, you don't need to be a coding wizard or a graphic designer. You need to become a Data Storyteller
The Challenge
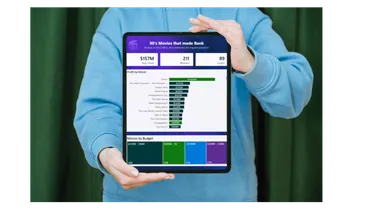
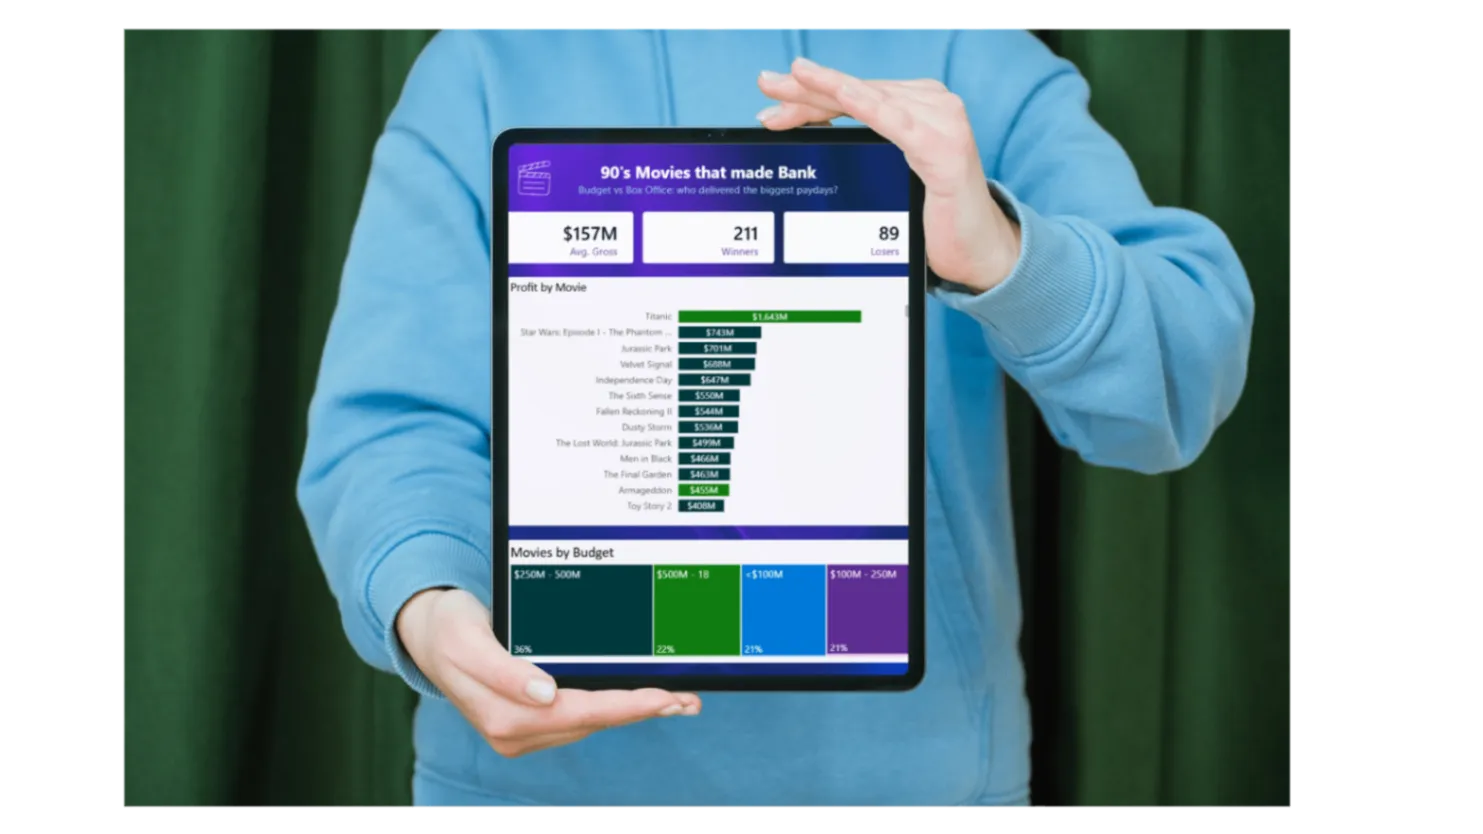
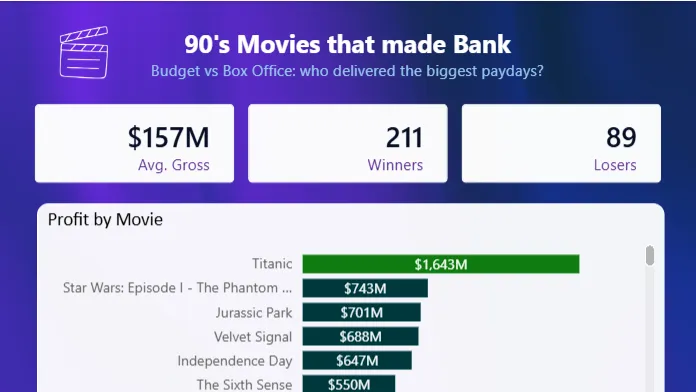
In this hands-on, guided challenge, we leave dry corporate spreadsheets behind. We take a real-world dataset on 1990s Movie Releases (budgets vs. box office gross) and turn it into an story-driven visual.
Uncover:
- Which blockbuster budgets were complete gambles, and which actually paid off?
- What was the real sweet spot for Return on Investment (ROI)?
- How do you present the data so people remember the insight long after the meeting ends?
The 6-Step Repeatable Framework:
- Set Intentions (Stop Chart-Dumping): Learn to define the core story before touching a single visual.
- First Draft (Make It Visible): No overthinking, no styling, just making the trends readable.
- Spot the Insight (Find the "Aha!"): Interact with your visuals to uncover hidden patterns, build custom ROI measures (DAX provided!).
- The Glow Up (Clarity): Fix the hierarchy, declutter your canvas, and use colors so your main takeaway jumps off the screen.
- From Insights to Story (The 3-Part Pitch): Master the presentations: A strong hook + Visual proof + A clear recommendation.
- Showcase Your Work (on Linked In): Publish your dashboard, share your thinking process, and build a public portfolio on LinkedIn that gets you noticed.
What You Get:
- ✅ Step-by-Step Video Walkthroughs
- ✅ Plug-and-Play Code Snippets
- ✅ A Framework You Can Use Foreve
- ✅ Public Portfolio & Community
- ✅ Confidence in Storytelling
Who This Is For:
- Analysts & BI Developers who are tired of building reports that get ignored and want to drive real business decisions.
- Data Career Switchers who want an approachable, non-intimidating framework to stand out in job applications.
- Anyone who believes data shouldn't be boring and wants to turn numbers into stories people actually care about.
Start today!